The share of the population subscribing to streaming services continues to grow worldwide. As of August 2020, 62% of adults in the US region had a subscription to a streaming service. In countries like India, the growth rate is quite substantial – the OTT subscriber base in India grew by a whopping 30% between March and July 2020 alone.
Ensuring a better user experience has become one of every service provider’s primary objectives to attract and retain subscribers. There has been a realization among providers that it is not enough to be content-rich.
User Experience (UE) gets bifurcated into User Experience and Quality of Experience (QoE) for an OTT application. Going by the definition of Quality of Experience, it is a holistic concept that must encapsulate all service aspects. It is a user’s degree of delight or dissatisfaction with the entire service.
Any attempt to measure and analyze QoE has to ensure that every facet of the video delivery is considered. The end-toend video delivery workflow has many moving parts, starting from content sources, encoder, DRM, packager, CDNs, and various platforms (plus the apps, players) over which the video is finally consumed. From an empirical standpoint, one can relate this to measuring KPIs from the network, player, video playback, and application [or firmware] itself. Video start-up times, buffering occurrences, frozen video, and the player’s ability to catch up to the highest quality are some of the well-known areas of measurements.
Measurement of these KPIs alone may not help streaming or app teams make the best decisions on improving streaming quality. To start with, the measurements need to be as precise and accurate as possible. Proper aggregation and correlation techniques combined with an easy-tounderstand visualization are equally important.

The whole gambit of QoE assessment is created around the end device. QA teams often see NFR testing as a sub-category of tests that may take less priority than the heavier & bigger functional test case list. For example, the number of functional tests for an OTT app can be in the range of 3000; however, the number of NFR test cases may very well be less than 100. Owing to this, QA teams may end up taking a reactive approach to NFR testing. This can often lead to testers devising manual ways of measuring app performance, video starttimes, detecting occurrences of buffering, and so on. Some companies may not even consider these as part of their test coverage.
Manual assessment of NFR later gets shifted to semi-automated ways. However, the entire process of testing can be monotonous and timeconsuming. Above all, the tests by themselves will not show the connection between different layers of KPIs, let alone show any correlations at all, for example, correlating the player’s behavior at a given instance in time to a spontaneous network issue. It won’t be easy to measure a KPI like video start-up time against varying throughput levels available to the application, using manual or semi-automated ways. Measuring a KPI like start-up time against throughput is essential because it is often affected by last yard challenges. So, the correlation between the last yard network throughput and start-up time is critical to point fingers in the right direction instead of blaming just the CDN.
If an automation tool is to be used for QoE assessment, it should be a tool that was created with NFR and QoE measuring capabilities as one of the primary design considerations. Just like automating functional tests, automating a QoE measurement also requires logic to be created. This will often consist of navigation of the UI, searching for content, initiating a playback, and further playback controls. We can picture this as a list of QoE automation scripts designed to measure all the KPIs defined.
One may think that this can be done using their test automation tool itself. Of course, there are test automation solutions that address the NFR testing. However, most of the APIs in them are atomic and are designed to measure just the performance scenario and supply the measurement back to the script. It then becomes the script developer’s job to ensure that this data is persisted along with other relevant data points. In other words, a QoE KPI measured as just one number isn’t useful – it has to be measured along with a set of other parameters that define the state of the system when the measurement had taken place. This also means that the same KPI has to be measured multiple times by altering the parameters that can potentially affect the KPI. Measuring buffering ratio against varying Wi-Fi signal strength levels (received at the end device) is one example.
The ultimate goal of measuring QoE is to enhance it further. To make this happen, the assessment framework should offer a comprehensive set of features on the scripting, data acquisition, aggregation, and visualization layers so that the user (who designs & writes the logic to measure the KPIs) can focus on precisely that and not on how to deal with the data returned by an API, how to aggregate several data points and how to derive meaningful statistics and reports.
A good automated QoE measurement system offers the user the proper playground where the QoE data collection has to occur. This signifies that when the system executes logic to measure, say, video start-up time, it is also ensured that all the other intrinsic data points are also collected along. This may include download and upload rates, network requests and responses, player/app logs, crashanalytics data, and so on. In other words, the system has to be aware of the context of measurement. It should automatically be on the lookout for all data points necessary to triage and decide on actions to be taken for improvement. This capability is a clear line of separation between QoE tools built for purpose and NFR capable test automation tools.

The typical NFR APIs in a functional test automation system are often not designed to ensure the highest levels of precision and accuracy. Based on our observations, a typical performance API that detects an application start or the start of a video playback comes with precision levels in the range of 300-900 milliseconds. As far as accuracy is concerned, there is always a delta caused by the device control command latency, such as a tap on a play button. This is usually in the range of 200 to 500 milliseconds.
These above-mentioned precision and accuracy levels are not good enough for QoE assessment using an automated system. This is because the values are not only measured but are also used for correlation with data collected at high sampling rates. As stated above, correlation a critical element for improving QoE. There is no point in sampling network at 100 milliseconds when the video performance measurement precision is roughly 900 milliseconds. One should be able to see the exact time gap between the change in bandwidth, the subsequent adaptation of bit-rates at the player end, and a buffering that occurred on the screen in between. It will be ideal if the video side of measurements achieves frame-level precision (about 20mS for 60fps, 40mS for 30 fps video). Player’s adaptation to changing bandwidth levels and during the start-up is a critical factor in QoE, more so in bigger and high-resolution screens (TVs) because viewers can easily spot quality differences between the lower bit-rate streams vs. the highest bit-rate stream in those screens.

Measuring video transitions at a frame level can be a costly operation for CPU and memory. This is even more so when there is a need to scale. Every research or project that deals with artifact detection in a video stream invariably talks about achieving the required levels of real-time performance. This will remain one of the primary criteria in deciding whether or not the solution is production-ready and can be easily scaled.
When designing pixel-based algorithms, one needs to be mindful about pre-empting a computational catastrophe and provisioning ‘safety valves’ so that these algorithms do not hog a lot of CPU and memory. It is essential that the framework drives such analysis with smarter ways of optimization. This has to start from accepting inputs from the user. The user’s need will vary from running things at realtime to achieving maximum accuracy & precision.
Suppose the system simply exposes an artifact detection algorithm to the user without being empathetic about the actual need (same algorithm may satisfy different needs). In that case, it can lead to unnecessary computational overheads. For example, if the need is to differentiate between a 6-second start-up vs. an instant start-up, the algorithm need not be driven at full throttle and at frame level. The QoE measurement APIs have to offer this kind of flexibility to the user – essentially a handy set of control levers to drive them for the exact need.
Compressed domain techniques can turn out to be more efficient than pixel-based ones. In some cases, like the subjective quality assessment, they may be the only practical choice too.
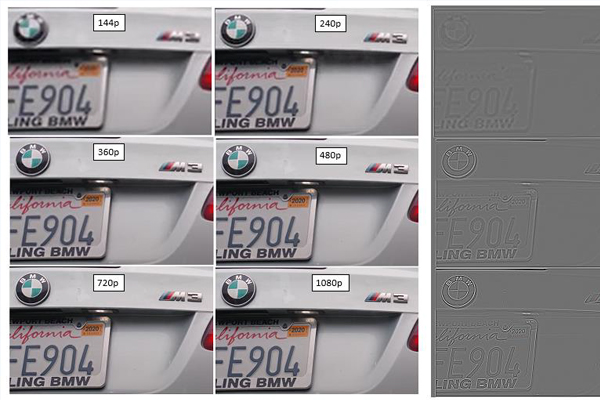
Figure 1: High pass filter yielding edge detection in the spatial domain
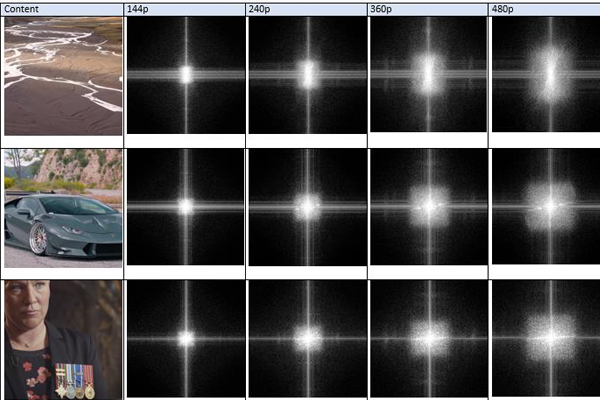
Figure 2: Fast Fourier Transforms (Frequency domain) done on video frames of different quality
The above figures are samples taken from the experiments done on detecting subjective video quality. The first one is done on the spatial domain. To get useful results, one may have to apply different masking and preprocessing techniques before doing an edge calculation to detect quality levels. This type of processing can often be highly demanding on the CPU, which can degrade the overall system performance. It is advisable to have limiters or thresholds defined for preventing over usage of system resources.
The second figure is depicting transformation to the frequency domain. It shows an FFT output varies for different video quality levels from 144p up to 1080p (Reference to YouTube’s bit rate laddering). It will be relatively easy to deduce subjective quality scores from these compressed domain techniques than just operating on the spatial domain itself. These types of transforms are also more ideal for machine learning techniques – the training datasets confine to a particular kind of pattern than just any possible video frame out there.

Operators who strive to achieve higher user experience levels and QoE – the line between these is blurred – must give a fair share of their attention to the proactive assessment of QoE KPIs. In principle, automated ways of assessment are merited over manual techniques.
Companies trying to narrow down on the test framework for QoE may want to consider the points outlined in this document. In other words, the tool selection shouldn’t be made only based on the automation capabilities of a testing tool.


 Multidevice automation
 Playback testing
 Last-yard QoE testing
 Content Monitering
 QoE KPI Monitoring and Validation
 Smart Automation Tools
 Comprehensive Reporting